The Whiteboard Mind

In the age of digital tools, where every idea has a place in an app and every plan sits behind a login screen, the humble whiteboard continues to command its own quiet power. For many thinkers, creators, and problem-solvers, it remains the most dynamic canvas, a space where thoughts breathe, flow, and transform. For someone like me who designs projects, plans strategies, brainstorms ideas, and lead teams, the whiteboard and marker pen are not just tools. They are extensions of the mind,  translating abstract thought into visible structure. It’s not nostalgia or resistance to technology; instead, it’s about harnessing a form of thinking that is visual, kinetic, and alive.

There’s a deep psychological connection between movement and cognition. When you draw or write by hand, especially on a large surface like a whiteboard, you activate a different mode of thinking. The body participates in the act of thought. The hand sketches a relationship, the eye follows it, the brain reinterprets it, and new connections emerge almost instinctively.

Typing or clicking on the keyboard keeps the mind linear, confined to lists, bullets, and boxes. But drawing on a whiteboard invites a non-linear form of exploration. You can start anywhere, a square, an arrow, a phrase, and the rest begins to grow organically. This freedom to expand, erase, and rearrange is what makes it such a powerful thinking process. Each line is a possibility. Every arrow, a hypothesis. And each erasure, a moment of learning. When thoughts become visible, they also become testable. A whiteboard externalises the inner dialogue of the mind. It takes ideas that could remain foggy abstractions and turns them into something you can point at, challenge, and reshape.

This visibility is particularly powerful in complex problem-solving or project design. When working through implementation challenges or building systems with multiple moving parts, you can literally ‘see’ the interactions. Causal diagrams, mind maps, and process flows make dependencies clear and highlight gaps that words alone might obscure. You can stand back and see the whole ecosystem, how resources connect, where bottlenecks might occur, or which variables influence outcomes. The whiteboard gives you that clear view while still allowing you to dive into details when needed. It’s thinking at both the macro and micro levels, which is simultaneously intuitive and analytical.

Every creative or strategic process begins in some form of chaos. Ideas compete, assumptions overlap, and clarity hides behind complexity. The whiteboard is where that chaos finds its first structure. Drawing mind maps is often the first step, not because they provide answers, but because they show relationships. From one central idea, branches grow, each representing a sub-theme, a factor, or an alternative. You can add, cross-link, or reframe them without fear of permanence. The visual form allows you to rearrange logic faster than your words can catch up.

Causal diagrams, in turn, help identify the forces at play of what leads to what, what influences what. In project planning, this is invaluable. You can trace dependencies between actions, timelines, or external conditions. You can see where interventions matter most. You can uncover loops, positive or negative, that either amplify progress or create recurring setbacks. In a sense, the whiteboard becomes a mirror of systems thinking. It holds complexity while keeping it human and accessible.

The whiteboard isn’t just a personal tool; it’s a shared language. I often use it in team meetings or group ideation sessions, as it turns abstract discussion into a collective visualisation. People see not only what is said, but how it connects. Misunderstandings surface faster because assumptions become visible. When everyone’s looking at the same diagram, they’re also looking at the same version of reality and not one filtered through individual interpretation.

It democratizes contribution, leading to one common understanding. A quiet team member can point at a link and ask, ‘Why does this connect here?’ or suggest a missing node. Visual representation invites curiosity and challenges hierarchy. It’s no longer about who talks the most, but about what the group sees together. Moreover, it encourages iteration. Unlike digital slides or documents that feel fixed, a whiteboard remains fluid. You can erase, redraw, and refine as the conversation evolves. Every stroke on the board is an act of co-creation. Even with PowerPoint presentations, I often end up on a whiteboard (if available) to explain concepts, flow, and possible results. It has proven to be an excellent tool for scenario visualisations.

There’s also the element of speed. With a marker in hand, you can think and draw at the pace of your thoughts. There’s no formatting, no tabs to open, no distractions from notifications or interfaces. When you’re solving implementation challenges or breaking down a project into actionable components, this speed matters. You can move from problem to hypothesis to possible solution in seconds. The visual rhythm keeps the momentum alive. And because it’s temporary and erasable, there’s less fear of getting it wrong. You can test a scenario, discard it, and move on. This low-cost experimentation fuels creativity and decision-making alike. In fact, the transient nature of a whiteboard is part of its strength. It reminds you that ideas are living entities to be evolved, not preserved.

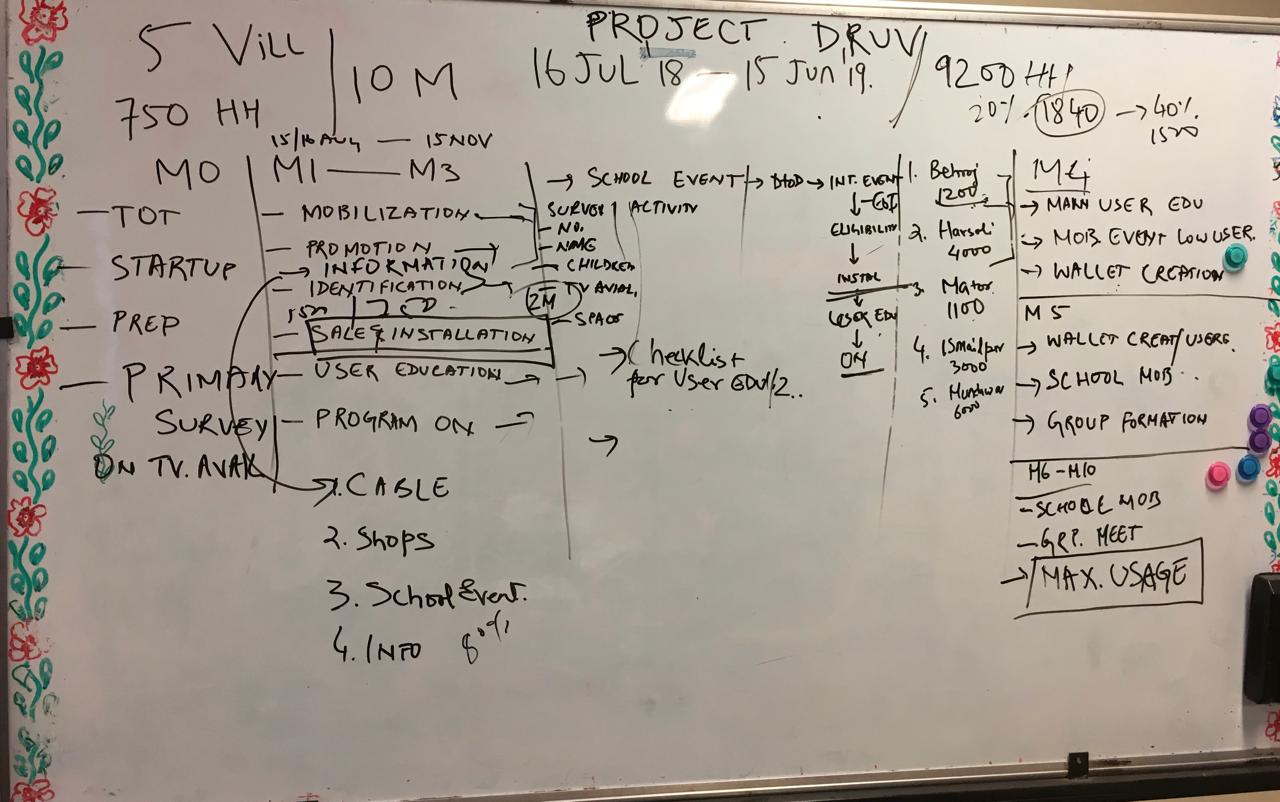
When designing projects, a whiteboard allows for holistic structuring. You can begin with purpose at the centre, draw out stakeholders, resources, activities, and outcomes, and gradually watch a project take shape like a constellation. At this stage, aesthetics and functionality merge. The diagram is not just a record; it’s a design prototype. You can visualise workflows, timelines, partnerships, and even behavioural change models. Seeing everything laid out helps identify what’s missing and what’s redundant. For ideation, it’s even more liberating. The blank board is an invitation to explore. You might start sketching something unrelated, only to stumble upon an insight that reframes the entire problem. The act of drawing keeps your attention anchored and your imagination open.

Often, my Millennial and Gen Z associates argue that digital whiteboards and collaboration tools replicate all these benefits, but there’s something irreplaceable about standing in front of a board with a marker. Your posture changes, your mind sharpens. The body’s movement through space, stepping back to observe, leaning in to draw, engages multiple senses. It’s immersive in a way screens can’t replicate. A whiteboard has boundaries, forcing you to prioritise. What fits stays, and what doesn’t must be distilled. This physical constraint often leads to conceptual clarity. Maybe the old school professor in me has a bias!

Using a whiteboard and marker isn’t about rejecting modern tools; it’s about complementing them. Digital systems store and polish. Whiteboards create and provoke. For anyone who works on complex projects, leads teams, or solves multidimensional challenges, the whiteboard offers a cognitive advantage as it makes thinking tangible. It transforms abstract reasoning into something you can walk around, discuss, and reshape. It reminds us that clarity isn’t found inside the mind alone; it’s constructed through visible relationships and shared understanding.

For me, the whiteboard is more than a surface; it’s been my live, on-the-spot thinking companion. Every mark carries curiosity; every erasure, humility. It captures not just what we know, but how we learn. To think with a whiteboard is to think in motion. It’s a dialogue between mind, hand, and idea. It’s where chaos meets order, and where clarity emerges, not from control, but from exploration. In a world of digital efficiency, perhaps the most human form of innovation still begins with a marker, a blank board, and the courage to draw what we don’t yet fully understand.
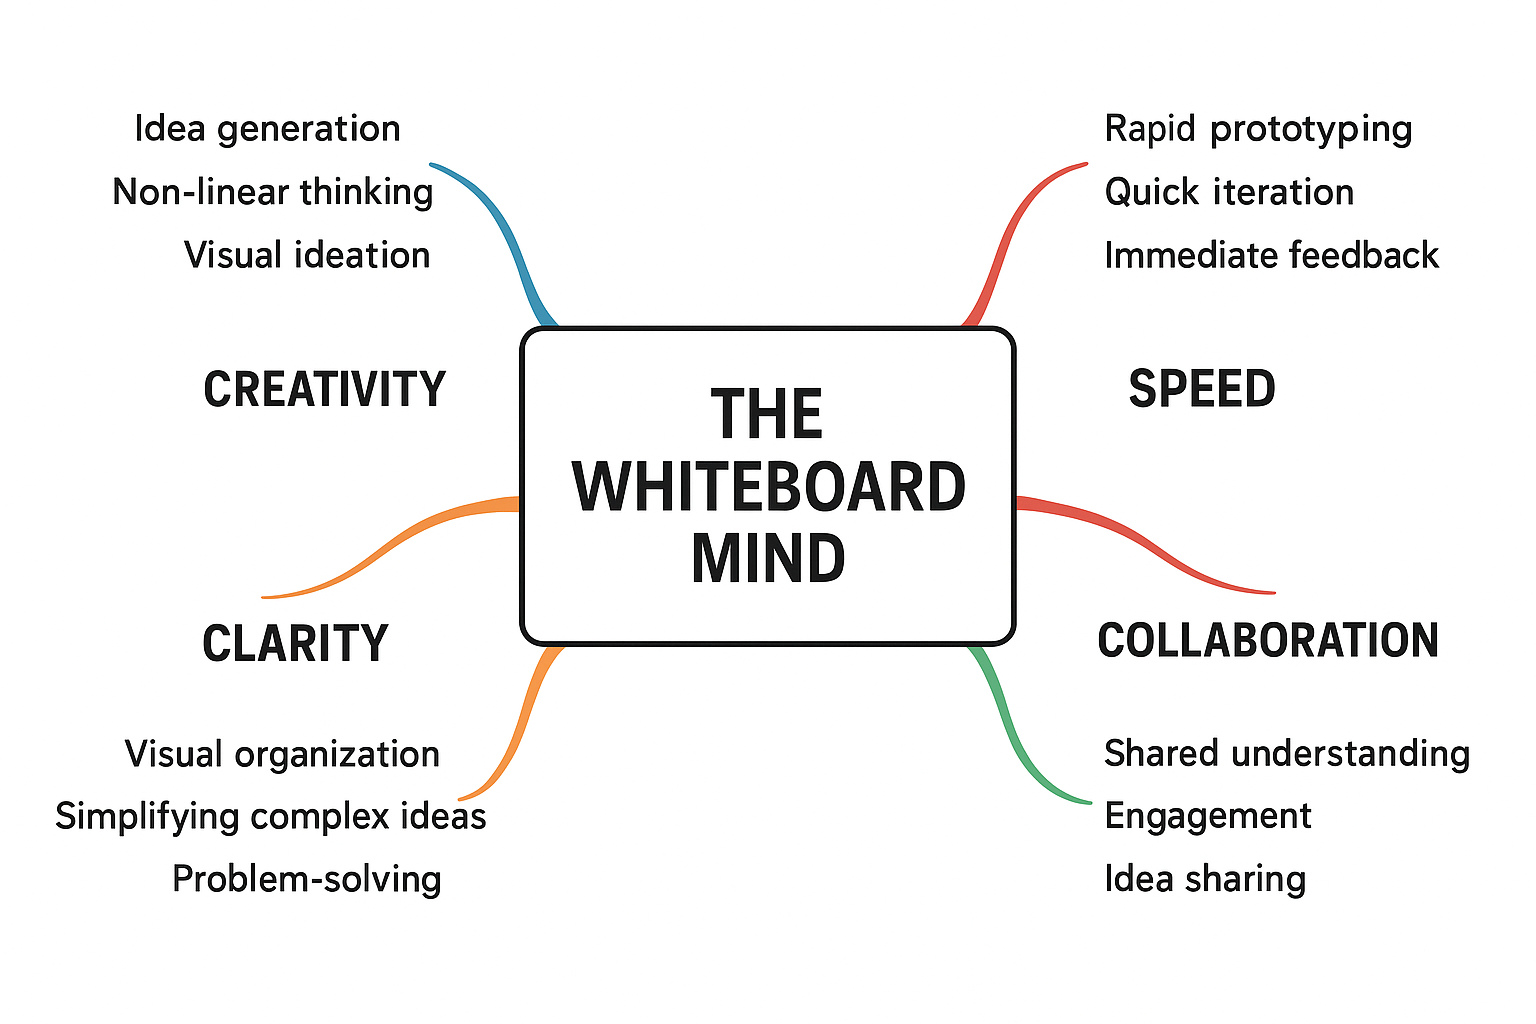
How to design LogFrame

LogFrame (Logical Framework) is a widely popular tool for project design, planning, monitoring and evaluation. It is however most often used in the planning or re-planning of a project.  The method was first developed in the early 1970s.  It is used by bilateral and multilateral agencies including the World Bank, the Asian Development Bank, the Food and Agriculture Organisation (FAO), Overseas Development Agency (ODA) and the US Agency for International Development (USAID), and most Non Profit Organizations across the globe today.

Logframe is most useful in helping to identify the elements of a project and the linkages between them in a logical, concise and objective manner.  It introduces order and discipline into the project design process and helps place the project in the larger context of a program or sector plan.  It also serves as a tool for logically identifying inputs, assumptions for success, outputs and indicators for monitoring progress and evaluating performance.

The term LogFrame is often loosely used to refer to both the process or concept of project analysis and the matrix outcome of this process.  The Logframe concept is often referring to the thought process, and the matrix is the visible result. LogFrame involves the following procedures:

  • Setting project objectives
  • Defining indicators of success
  • Identification of key activity groups
  • Defining critical assumptions on which project is based
  • Identification of verifying project accomplishments
  • Defining resources required for implementation.

Basic Steps

The guiding methodology of LogFrame is the concept of causality, or cause and effect.  It suggests in any development activity or project, resource inputs are used with activities to produce outputs; outputs are expected to achieve project purposes; and the achievement of purposes is expected to contribute to the achievement of a higher order goal.

The basic premise is that there is a hierarchy of objectives, and the achievement of success on higher levels in the hierarchy is often subject to factors beyond the control of planners and managers.  As a result, the achievement of a level may not be sufficient for the achievement of the next level.  The linkage or progress from one level to the next is therefore conditional on the continuing validity of stated assumptions.

The following are the basic steps for developing a project design using a Logical Framework.  The basic principle is to go from the general to the specific.  That is, begin with the Narrative Summary and several key assumptions, then try to put indicators and targets on the general statement of objectives.

The Narrative Summary refers to the first 4 steps which include:

  1. Define the Purpose
  2. Define the Outputs for achieving the Purpose
  3. Define the Activity groups or Components for achieving each output
  4. Define the overall Goal
  5. Verify the vertical logic with the If/then test
  6. Define the Assumptions required at each level
  7. Define the Objectively Verifiable Indicators (OVI) at Purpose, then Output, then Goal levels
  8. Define the Means of Verification
  9. Put costs on the Activities: the Performance Budget
  10. Consult the Checklist for the Logical Framework
  11. Review the Logical Framework design in the light of historical experience with similar efforts

Step 01: Define the Purpose

This is to define WHY the project is being done.  The Purpose describes the desired impact we hope the project will have, or how the situation is envisaged at its completion.

For example, a Purpose typically describes the development expected: to develop sustainable water supplies for the people of a certain village; or to develop a manageable rural health service accessible to all in a certain region.

As a rule of thumb, a project have only one Purpose although a project may have more than one purpose.  The reason for this is practical.  Experience demonstrates that it is easier to focus project Outputs on a single Purpose.  Multiple purposes diffuse project efforts and weaken the design.

Step 02: Define Outputs for Achieving the Purpose

Outputs are WHAT the project is to accomplish, or the direct, identifiable and measurable results expected from the provision of inputs together with the execution of activities.  These are the deliverables or Terms of Reference (TOR) for the project, the results for which the project can be held directly accountable and for which it is given resources.

Step 03: Define the Activity Groups or Components for Achieving Each Output

Activities are the discrete tasks undertaken using resource inputs to achieve defined outputs.  Description of the activities should include the basic actions of the project team: the summary schedule, meetings, monitoring events and evaluations.

Step 04: Define the Overall Goal

The goal is the rationale of the program or project.  The higher-order objective that this project, combined with others, will achieve.  Usually this a program or sector objective.  Very often a portfolio of projects will share a common Goal statement.

Step 05: Verify the If/Then Vertical Logic

By definition, each project has this If/Then or cause and effect logic embedded in it.  If we produce certain outcomes under certain conditions, then we can expect certain other outcomes to result. LogFrame forces the team to make this logic explicit, but it does not guarantee a good design.  The validity of the cause and effect logic depends on the quality and experience of the design team.

Step 06: Define the Assumptions Required at Each Level

Assumptions are statements about the uncertainty factors between each level of objectives, external factors over which the project chooses not to exert or does not have control.  This is the external logic of the project. Determine the Assumptions by asking, what conditions must exist in addition to my objective (Activity, Output, Purpose, Goal) in order to achieve the next level? It is important to clarify Assumptions although there is never 100% certainty of success in any project.  However, the lower the uncertainty, the stronger the project design.

Step 07: Define the Objective Verifiable Indicators (OVI) at Purpose, then Output, then Goal Levels

Objectively Verifiable Indicators (OVI) are performance indicators.  They demonstrate results. Begin with the higher order objective and work backwards through the causal chain: Goal then Purpose, then Outputs, then Activities.            Indicators are often stated in terms of Quantity, Quality and Time (and sometimes place and cost).  The act of putting numbers and dates on indicators is called TARGETING.  It is not true that higher order objectives are not measurable.  We may choose not to put targets on them, but Goals, Purposes and Outputs can all be given indicators and targets.         The fewer indicators the team uses the better.  Use only the number of indicators required to clarify what must be accomplished to satisfy the objective stated in the Narrative Summary.

Step 08: Define the Means of Verification

The Means of Verification (MOV) describes the sources of information that will demonstrate what has ben accomplished. If we decide that a survey is needed, then we may need to add some action steps to the Activities List.  If this costs money, we must add this to the budget. The rule is: the indicators you choose for measuring your objectives must be verifiable by some means.  If they are not, find another indicator.

Step 09: Put Costs on the Activities — the Performance Budget

The budget in the LogFrame should be a simple, line item budget for completing the Activities.  Frequently the budget will be followed up by an attachment of a detailed budget spreadsheet.

Step 10:  Consult the Checklist for the Logical Framework

Use the Design Checklist and ensure that your project meets all the requirement of a well-designed LOGFRAME.

Step 11: Review the Logical Framework Design in the Light of Historical Experience with Similar Efforts

Consult other projects or colleagues in the field and compare your design to similar project designs.  This will give you more insight into your own project.

Note: If you need an external reviewer to go through your LogFrame, feel free to write to me at: manu@manumayank.com I will be happy to help.